We had some discussion on Price Sensitivity earlier. This was used for determining the Right Price of offer for that customer. However, the price sensitivity is more related to Demand Elasticity

How to use Relative Price to understand Customer Behaviour
 Relative price provides very much useful insight about the customer's behaviour. The following would be the typical values for Relative price
- High
- Medium
- Low
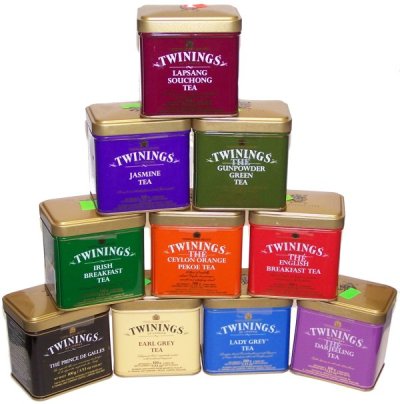
 different price preferences (Twinnings Tea might be a High valued one, while Tetley might be Medium priced; depending on the purchase behavior of each individual across category the following Relative Pricing Table is created)
| Cust ID | Category | Premium | High | Medium | Low |
| RF0000123 | OVGT120980 | 0 | 6 | 16 | 0 |
| RF0000227 | OVGT120980 | 11 | 3 | 2 | 0 |
Relative Pricing Customer Table
The above methodology can be used and the following can be used as Segmentation variables
- No of High Value Items
- No of Medium Value items
- No of Low Value items
Please try this out and let us know the difference it brought to your segments
How to measure effectiveness of Switcher Campaigns in Retail
Switcher campaigns are the one that disrupt brand loyalty and tease an otherwise loyal customer to switch over to the competitor. Tetley and Brooke Bond are competitors - what would be the impact of providing an offer on Brooke Bond tea for a Tetley fan.
dunnhumby's analysis on offers finds Switcher campaigns are always the worst performing. According to the reporthouseholds tend to buy more of their favorites, such as Coke products, or a new Coke product, if offered an incentive rather moving to Pepsi for example

